
Measuring what matters: aligning metrics with customer journeys
In 2020, while preparing for another Service Design Days conference, I met a few times with Jeff Gothelf and Jess McMullin to prepare for a special workshop on lean service design. We talked about the lack of outcome alignment we often see in organisations. Many (design) teams measure effort, not impact.
Gothelf, co-author of the book ‘Who does what by how much? A practical guide to customer-centric OKRs’, has long advocated for goal systems that centre on customer behaviour, not just internal deliverables. In his words: “We advocate for customer‑centric OKRs where the objective is a qualitative statement about a future benefit for customers, and key results are outcomes measuring user behaviour that indicate you have delivered value.” But we may recognise the following volume-based activities to be measured instead: number of journey maps created, customer interviews conducted, bugs fixed, webpages redesigned, etc.
These activity or vanity metrics (Eric Ries) often make teams feel productive. But as Ries warns us, these vanity metrics make you feel good, but they don’t offer clear guidance for what to do. Organisations say they want to improve customer experience, but then reward internal teams for for instance speed, volume, or cost-cutting. They commission detailed journey maps but continue tracking success through siloed or even outdated KPIs. The result is a growing disconnect between what organisations measure and what actually matters to the customer.
What are OKRs and KPIs
It’s good to briefly talk about what Objectives and Key Results (OKRs) are. Objectives are your high-level goals, qualitative goals for teams, products, services or business. Key Results are how you measure success, whether your goals have been achieved, through observable behavioural change in the people who use your services. So, instead of the usual goals that describe outputs and systems, OKRs done right define desired outcomes and behaviours. According to Gothelf, that’s a mindset shift: “Reframing your goals as outcomes instead of outputs is a significant shift in your organisation’s ways of working. It should be hard. It should force you to think about how you serve your customers, how you build products and services and how you measure success.” An outcome is a measure of human behavior. These behaviours don’t happen in a vacuum. The context/circumstances, including prior and subsequent steps/interactions matter. On the other hand, Key Performance Indicators (KPIs) are impact metrics; high level measures of the health of the business. So, while OKRs drive change and strategic alignment, KPIs quantify past and current performance, and monitor existing processes. They complement each other. KPIs can be used as key results within an OKR framework, providing a measurable way to track progress towards a specific objective.
Service design, metrics and measurement
In the article ‘An Empirical Study of How Service Designers Use Metrics’ (2023) the authors and researchers highlight the value of using metrics in service design practice and a gap in systematic knowledge. They also underscore that organisational context can either foster or challenge the utilisation of metrics in practice. “Metrics can help teams calibrate plans and interactions by evaluating the service against different stakeholder goals. […] Strong organisational collaboration is essential for establishing a data structure that can be used effectively to measure metrics. […] Developing a shared metrics system, repository, or tracker can enhance clarity and facilitate informed decision-making concerning customer, business, or project goals.”
The researchers first mapped participants’ reported methods and goals of using metrics throughout the design process and then mapped designers’ expectations for future metrics applications that could support and be supported by organisations in the design process:
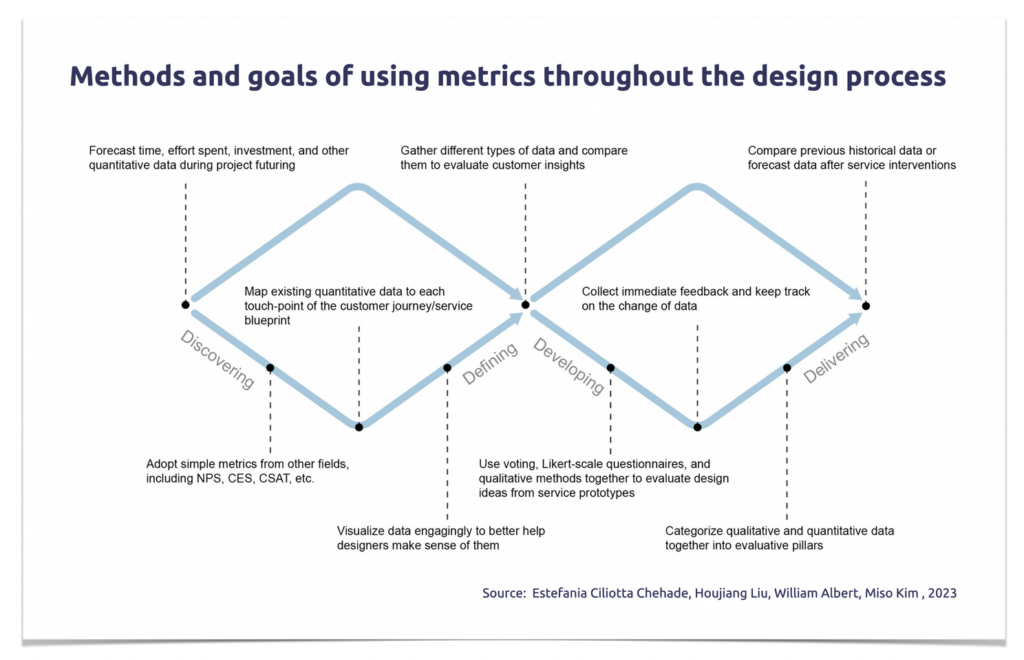
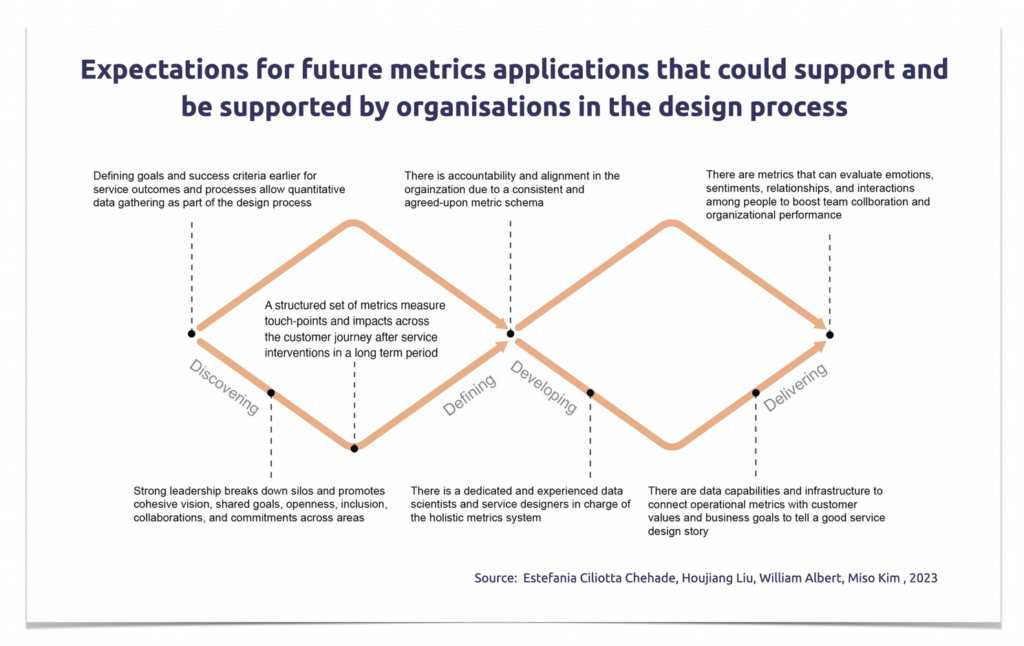
Many participants in their study indicated uncertainty regarding where to acquire the requisite knowledge. Consequently, they often resort to adopting evaluation methods from unrelated disciplines or integrating practices from business departments within their respective organisations. However, this approach inadvertently contributes to the fragmentation of metrics and their inconsistent application within the service design process.
According to the authors, this phenomenon underscores the existence of a complex landscape for service design metrics, characterised by a lack of alignment in their utilisation among practicing service designers, hence resembling a swampy ground in which the discipline navigates.
- Theoretical problems. There is a lack of recognition of metrics and understanding of what to measure. Reflecting on Robert Hoffman’s broad relationship between measurement and metrics, the initial focus should be on questions about what to measure and how to measure (i.e., the theory and concepts of measures) before establishing a specific measurement scale (i.e., metrics) to understand the impact of service design. However, the current approach often breaks down the problem of establishing service design metrics into the strategy of making measurements.
- Operational problems. Data collection is costly and requires high effort. It is difficult to demonstrate immediate impacts for long-term or transformational projects. Contacting customers to collect large amounts of quantitative data requires specialized skill and organisational support.
- Organisational problems. A strategic design culture is identified as the pivotal factor in promoting the use of metrics within and beyond design processes. In some highly mature organisations, tasks and activities are distributed across departments to facilitate the implementation of metrics. Generally, smaller teams and organisations face greater challenges in utilising metrics due to resource limitations. However, even in large organisations, there are instances where metrics are not valued, often due to a lack of leadership support.
The risks of having siloed and/or outdated metrics
Earlier in this article, I mentioned the risks of having siloed and/or outdated KPIs. These are metrics that reflect internal departmental success and efficiency rather than customer impact, and they often create blind spots in the overall customer experience. These include measures like average handle time in customer support (which encourages agents to end calls quickly rather than resolve issues thoroughly), number of features shipped in product teams (which rewards output over usability or adoption), email open rates in marketing (which say little about downstream conversion or satisfaction), or cost per ticket in operations (which may drive automation at the expense of empathy). While each of these KPIs might serve a local function, when left uncoordinated they encourage teams to optimise in isolation, often at the customer’s expense. Without alignment to end-to-end journey outcomes, such as onboarding completion, or repeat usage, these traditional metrics become barriers to true customer-centricity.
In other words, when different departments optimise for different things, conflicts emerge. For example, Marketing might focus on lead volume or conversion rates. Customer Service may be rewarded on handle time and ticket closure speed. And Service Design might be measured on outputs like workshop count or blueprint creation, or outputs related to service delivery, such as implemented touchpoints or documentation produced. Individually, these metrics may make sense. But in aggregate, they pull teams in opposite directions.
Another example: imagine a CX team improving service onboarding to a more premium, personalised, high-touch experience. At the same time, the support team is under pressure to cut call lengths. If those initiatives aren’t aligned, customers might get stuck mid-journey without sufficient help, because support staff are penalised for offering thorough guidance. Let’s be clear, this isn’t a failure of intent. It’s a failure of measurement design.
It’s important to solve this kind of misalignment and fragmentation. To find a framework to view customer experience horizontally, across silos, over time, from the customer’s combined with the organisation’s perspective. But, as mentioned before, when performance indicators remain anchored in vertical departmental logic, such a framework becomes window dressing.
I see three (there are more) ways misalignment can show up inside organisations: First, contradictory KPIs: A service design or CX team is tasked with improving customer satisfaction, while Marketing is rewarded for aggressive outbound campaigns that lead to customer frustration. Second, incentives that ignore outcomes: Teams are praised for completing features or sending communications, regardless of their effect on retention or loyalty. Third, lagging indicators only: If teams rely solely on post-experience surveys, they ignore real-time behaviour or journey-level metrics that could signal friction earlier. When metrics aren’t unified across the journey, no one is accountable for the whole experience. Each team optimises their part, even if it undermines the whole.
Of course, like Gothelf is stating, it starts with clearly communicating the ‘why’ behind OKRs:
1. What problem are we solving?
2. What does success look like?
3. How will OKRs help us get there?
By framing OKRs as a path to customer-centric success, we can transform our organisational culture and drive meaningful results. OKRs, done right, can truly open up an organisation to greater innovation and a deeper understanding of their customers. But remember, before you start thinking about a metric, you’ll first need to choose what you want to improve and what the improvement process should look like.
Integrating evaluative measurements into a holistic service design process
There is good news. Several service design scholars and professionals have developed frameworks and concepts to integrate evaluative measurements into a holistic service design process. Systematic approaches and methods are devised to diagnose each design stage and support decision making.
For example, Simon Mhanna created the Service Design Scorecard system to quantify service concepts and prototypes throughout the design process. Stefano Maffei, Beatrice Villari, and Francesca Foglieni propose incorporating evaluation methods throughout multiple design stages, aligning evaluation factors with organisational goals to enhance design effectiveness. Francesca Foglieni and Stefan Holmlid advocate a holistic evaluation approach that integrates objective, subjective, quantitative, and qualitative measurements to evaluate how value is delivered.
And Francesca Foglieni, Beatrice Villari, and Froukje Sleeswijk Visser underline the strategic nature of service design as a tool for innovation and competitive advantage, emphasising the need to consider user experience, business objectives, and organizational capabilities.
This article is a summary of an article published on LinkedIn in 2025